NO.1 Introduction to the study (excerpt)
T cells are activated when T cell receptors (TCRs) recognize agonists on antigen-presenting cells that bind to histocompatibility complex molecules. T cell activation is largely dependent on the spatiotemporal arrangement of TCRs on the plasma membrane. However, due to the diffraction limit of light, the molecular organization of TCRs on T cells is unclear. In this paper, the distribution of TCRs at the nanoscale and micrometer scale in lymph nodes was observed by direct stochastic optical reconstruction microscopy (dSTORM) and structure-borne illumination microscopy (SIM). This dSTORM and SIM approach provides the first evidence for multiscale reorganization of TCRs during immune responses in vivo. Nanoscale plasma membrane domains, called protein islands, are observed on unactivated T cells. These protein islands are enriched within the surface area in micron-sized sizes. In vivo, activation of T cells contracts TCRs regions, leading to aggregation of protein islands, forming stable TCR microclusters.
NO.2 Research results (excerpt)
1. On unactivated lymph node T cells, dSTORM visualizes nanoscale TCR islands
dSTORM imaging shows the presence of nanoscale TCR islands on T cells residing in the initial lymph node (Figure 1A). Detection of TCRs with monoclonal antibodies (H57) directly conjugated to the β chain with Alexa Fluor 647 dye (AF-647). Simultaneous examination of cell surface and cross-section indicates specific staining on the plasma membrane of T cells. TIRF-based dSTORM images to distinguish between TCR islands and individual TCRs. TCRs are ordered on the plasma membrane of T cells of 5c.c7 cells (Figure 1B). Define TCR islands as sets of TCRs spaced less than 2.5 times the positioning accuracy (overlapping circles in Figure 1B). Most protein islands show a larger size, asymmetrical shape (Figures 1B and C).
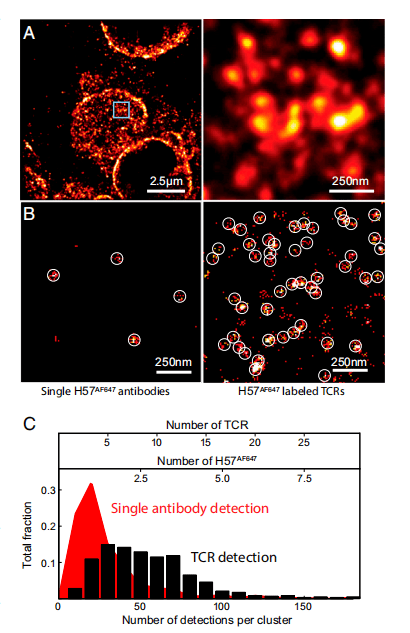 Fig. 1 Super-resolution imaging of TCRs on unactivated lymph node T cells
(A) dSTORM image of TCRs on unactivated T cells. (B) Cluster detection of H57-AF647 single molecules (left), TCR island labeled with H57-AF647 using TIRF-based dSTORM (right). The circles highlight detection events generated by a single antibody. (C) Characterization of the number of events detected per single antibody (red) and TCR protein island (black).
2. dSTORM indicates that T cells form TCR microclusters after activation
Compared to mouse T cells injected with MCC peptide, mouse T cells injected with MCC peptide have increased heterogeneity in shape, size, and membrane roughness (Figure 2A), and one subset of TCR in activated T cells has a size of 200-800 nm compared to unactivated T cells (Figure 2B). These structures resemble the microclusters described above. Local fluorescence density peaks in super-resolution images indicate reduced separation between protein islands (Figure 2C).
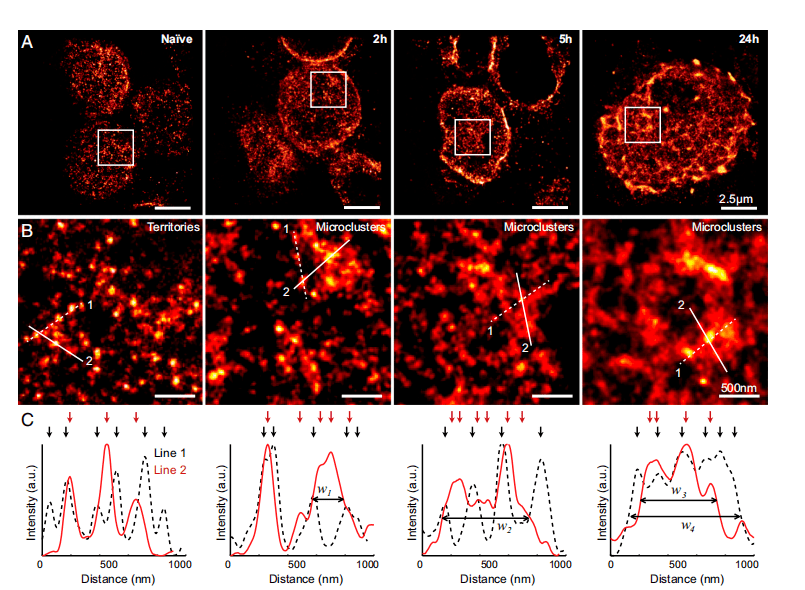 Fig. 2 dSTORM imaging of TCRs in lymph nodes before and after T cell activation in vivo
(A) Super-resolved images of mouse without MCC peptide injection and mouse T cells 2, 5, and 24 h post-MCC peptide injection. (B) The intensity distribution of the lines in the enlarged image (C) B in the white box of Figure A. The arrow markers represent the local intensity peaks of the protein islands. The decrease in the distance between adjacent protein islands leads to overlapping of intensity peaks and widening of structure (w1=240, w2=507, w3=533, w4=753nm).
3. SIM imaging of TCR islands and microclusters in T cells in lymph nodes
Use SIM to confirm dSTORM's findings. On unactivated T cells, SIM detects isolated TCR islands with a size of 100-300 nm (Figure 3A-C). After T cells were activated in vivo, the TCR distribution changed significantly, and the separation distance between assemblies was 200 ~ 500 nm (Figure 3D-F).
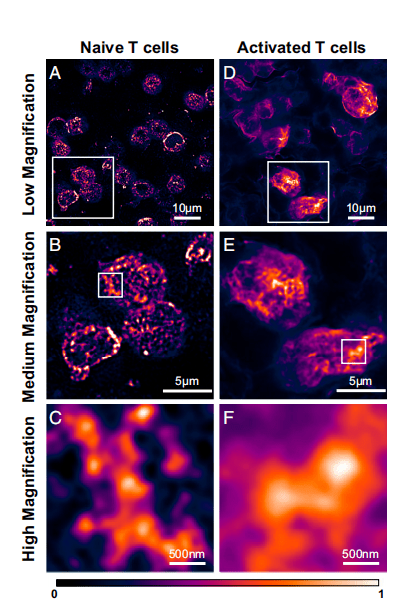 Fig. 3 SIM imaging of lymph node TCR before and after activation of T cells in vivo
(A) Low-magnification magnification of unactivated T cells. (B) Enlarged view of the white box in Figure A, showing the protein islands. (C) Enlarged view of the white box in Figure B, showing the TCR region and protein island in it. (D) Low-magnification view of activated T cells in vivo 5 h after peptide injection. (E) Enlarged view of the white box in D, showing areas with high density of TCRs on the plasma membrane. (F) Enlarged view of the white box in E showing a TCR microcluster.
NO.3 Research summary
In conclusion, the tissue rearrangement of TCRs before and after in vivo activation of T cells in lymph nodes was studied, subdiffraction resolution was achieved, and TCRs protein islands and regions on unactivated T cells were resolved. In mice injected with agonist polypeptides, microcluster formation was observed. This study provides multiple pieces of evidence for the spatial organization structure of TCRs in vivo.
References
Hu YS, Cang H, Lillemeier BF. Superresolution imaging reveals nanometer- and micrometer-scale spatial distributions of T-cell receptors in lymph nodes. Proc Natl Acad Sci U S A. 2016 Jun 28;113(26):7201-6. doi: 10.1073/pnas.1512331113. Epub 2016 Jun 14. PMID: 27303041; PMCID: PMC4932922.